|
Histo(V1)
Updated May 19, 2017 by
Sephirotess
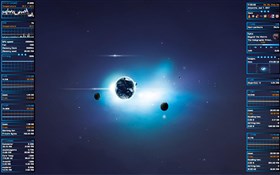
Histo(V1) by Sephirotess: for histogram
Options:
- 8 languages: English, French, Spanish, Italian, Portuguese, German, Russian & Serbian
- text color, font face, font size... can be modified,
- easy configuration. Use the "config panel" to change settings.
Section "Divers":
- Dock1: applications dock (8 links) + Windows dock + controls (hibernate...);
- Slideshow: it indicates the number of pictures in the folder & the total size...
- Time : full date (local language), time & Uptime.
Section "HDD":
- Letters (HDD C -> Z ): shows the letter of the HDD, as well as the name & the size of the disk. The skin shows used & free space (GB and percentages). It shows number of reading / writings by second. It also indicates the activity of the disk, reading / writing and cumulative readings and writings (by session). 1 histogram for used space & the other for free,
- Recycle Bin: shows the number of present files and their size. It also shows the rate of replenishment of the trash.
Section "Sound":
- Player: shows the name of the artist, the title of the song, title of the album and the cover album. It indicates the position of the title and the total length. Buttons: play/pause, stop, previous, next, volume up and volume down. Left click on the bar to modify the position of the track,
- Volume: left click on the percentage increase sound & right click decrease sound. Mute option and current audio device (left click to change it).
Section "System":
- Battery: shows battery level and option to change power settings (balanced, hig performance & power saver),
- CPU: shows number of cores, current temperature & hottest temperature of all cores (works with Coretemp). 1 histogram for the use & the other for temperature,
- GPU: GPU usage, speed, memory clock, memory used, fan speed and GPU temperature (with MSIAfterBurner). More informations are indicate via tooltip. To use them, you need to set your maxmimum GPU speed/memory/memory clock, in the config panel. 1 histogram for the use & other for temperature,
- Process: number of open processes. 5 top processes with CPU, RAM and total disk usage (readings & writtings),
- RAM: shows total, used and free RAM (GB and percentages). 1 histogram for the used RAM & the other for free,
- SWAP: shows total, used and free SWAP (GB and percentages). 1 histogram for the used SWAP & the other for free. Working set & private bytes.
Link for the wallpaper in the "info.txt". Original author unknown.
Thanks.
|


